
Website · Analytics · Full-funnel campaign
Design boldly. We'll handle the rest.
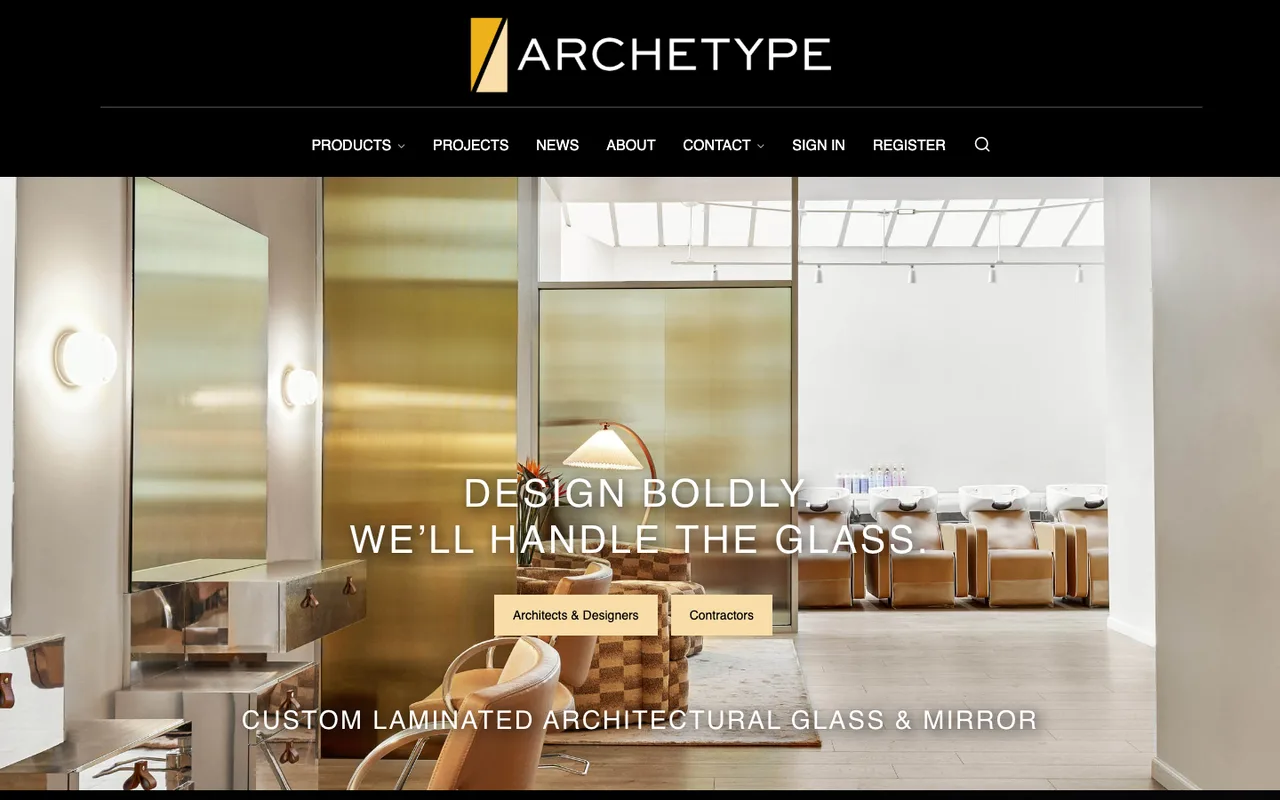
Archetype makes custom architectural glass. We rebuilt their website, stood up the analytics to prove it works, ran the campaign that fills it, then kept tuning all three against the numbers.
- +61.5%engaged visitors, month over month
- +164%glass saved to on-site collections
- 5xsite traffic in a day from one email
- 52.8%open rate on our best-performing send
Where we started
We inherited a blank slate.
When we took over the site, there was no analytics of any kind. No baseline, no heatmaps, no idea what a visitor did or where they gave up. So before we changed a thing, we built the way to measure it.
- Google Analytics 4 for the traffic, the channels, and where people drop.
- Microsoft Clarity for heatmaps and session recordings, so we can watch the real behavior, not guess at it.
- Constant Contact for the email program, opens, clicks, and what they lead to.
- A custom WordPress plugin we wrote that logs events on the server, so it counts even the visitors who block analytics in their browser.
Every number on this page is measured against a baseline we built.
What the data told us
The numbers pointed straight at the problem.
Archetype set a clear goal: more sample requests and more quote requests. The data kept flagging the same wall standing in front of it. New prospects hit a registration screen in the middle of browsing and left. Most visitors never scrolled past the top of the homepage. A search for one specific glass dead-ended with nothing.
We did not guess at fixes. We watched exactly where people got stuck, then went to work on those spots first.
What we changed
Then we adapted the site to the signals.
- Built the Glass Studio, Filter & Collect. A sidebar that filters across every glass type and lets a designer save the finishes they love. The data showed almost nobody was saving anything, so we built it. Saves climbed fast.
- Rebuilt the empty search. A search that used to dead-end now lands on a branded page: “Can't find the right glass? We can create it.” It has not lifted its conversion number yet, and we told them so, along with the next things we want to test.
- Fixed the guided tour and the product-card video so the site does more of the explaining on its own.
We report what moves the number and what doesn't. Both are the job.
What happened next
The numbers climbed.
- +27.7%active users the month the redesign shipped
month over month, the first full month of changes
- +164%glass saved to collections
49 to 129 in a single month, after Filter & Collect
- +61.5%engaged visitors
742 to 1,198 engaged users, month over month
- +764%email became a real traffic channel
11 to 95 sessions, month over month
Source: Archetype Glass analytics (GA4 and Microsoft Clarity), across the first six months of measurement.
One launch, a whole campaign
We used the new site as the spark, then let the data steer the campaign.
A new site is a reason to reach out. So we ran the whole funnel: a folded direct-mail piece, a run of project emails, and the first paid social. Then the measurement reshaped it. One email drove a fivefold jump in traffic in a single day, and nearly half the clicks went to a brand-new project page instead of the homepage. Project pages pull an email audience, so the next sends led with the projects.
-
Direct mail
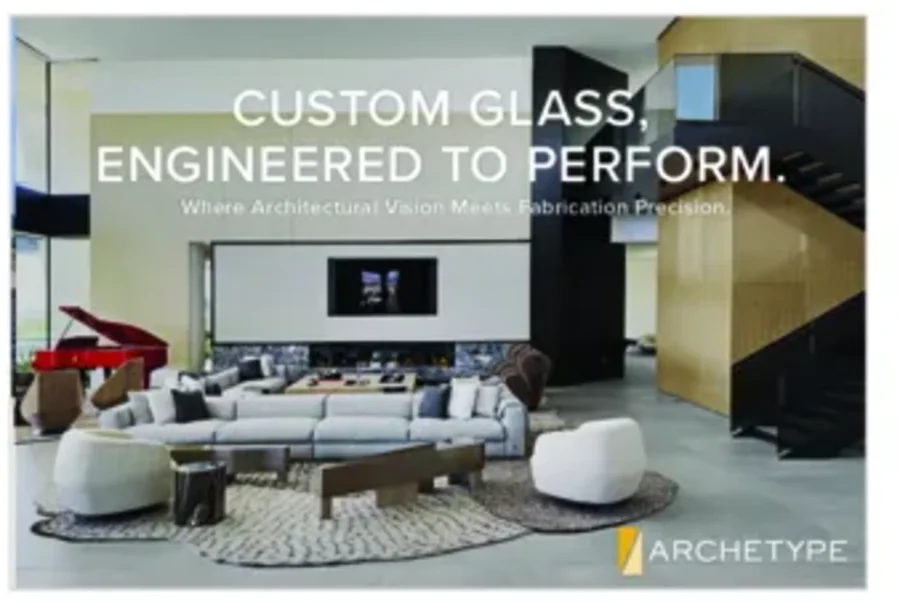
A folded mailer that put the glass on a prospect's desk, printed in-house.
-

The project email that drove the 5x day, and told us where its audience wanted to go.
-
Paid social

The first paid Meta push, aimed at people who had never heard of Archetype.
- 5xsingle-day traffic spike from one email
roughly 400 sessions a day to 2,245 in a day
- 46%of email clicks went to a project page
versus 32% to the homepage, so project pages pull email audiences
- 409net-new people from the first paid social push
brand-aware visitors who had never seen Archetype before
What it added up to
A site they are proud to hand a client.
The clearest proof is not on a chart. Archetype told us they use the website as a sales tool now. And the traffic and engagement keep climbing, because we never stop measuring. Every month we sit down together, read the results, and pick the next thing to fix.
“We are finally proud to show off our website when we talk to clients.”Barb and Kevin, Archetype Glass
“Beyond all these analytics, I just feel like we are busier.”Kevin John, Archetype Glass